The first piece that caught my eye was done by François Morellet and it consists of 40,000 red and blue squares.
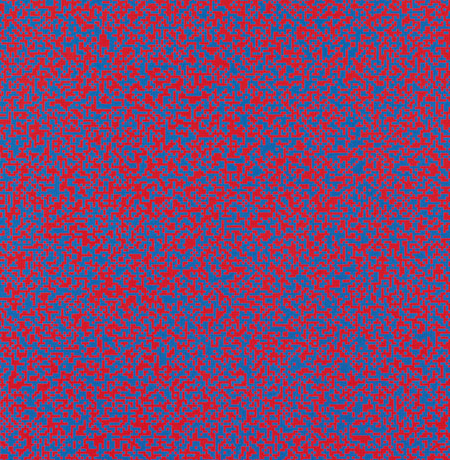
What really struck me about this work is the literal randomness of the squares and the feeling that it achieves. It almost hurts your eyes when you look at it for too long, and the “only” thing that went into it was assigning evens or odds to red or blue and going through thousands of phone numbers to pick what color to paint on each individual square. While this may seem like an ineffective way to create a piece like this, it communicates that Morellet’s idea was to create something unpredictable but at the same time tamed by the lack of variety in color choice.
Another work that stuck out to me was a piece by Ellsworth Kelly who used a method that we just did – cutting and pasting color coated paper, but instead he did it randomly in order to convey a fuller piece of art.
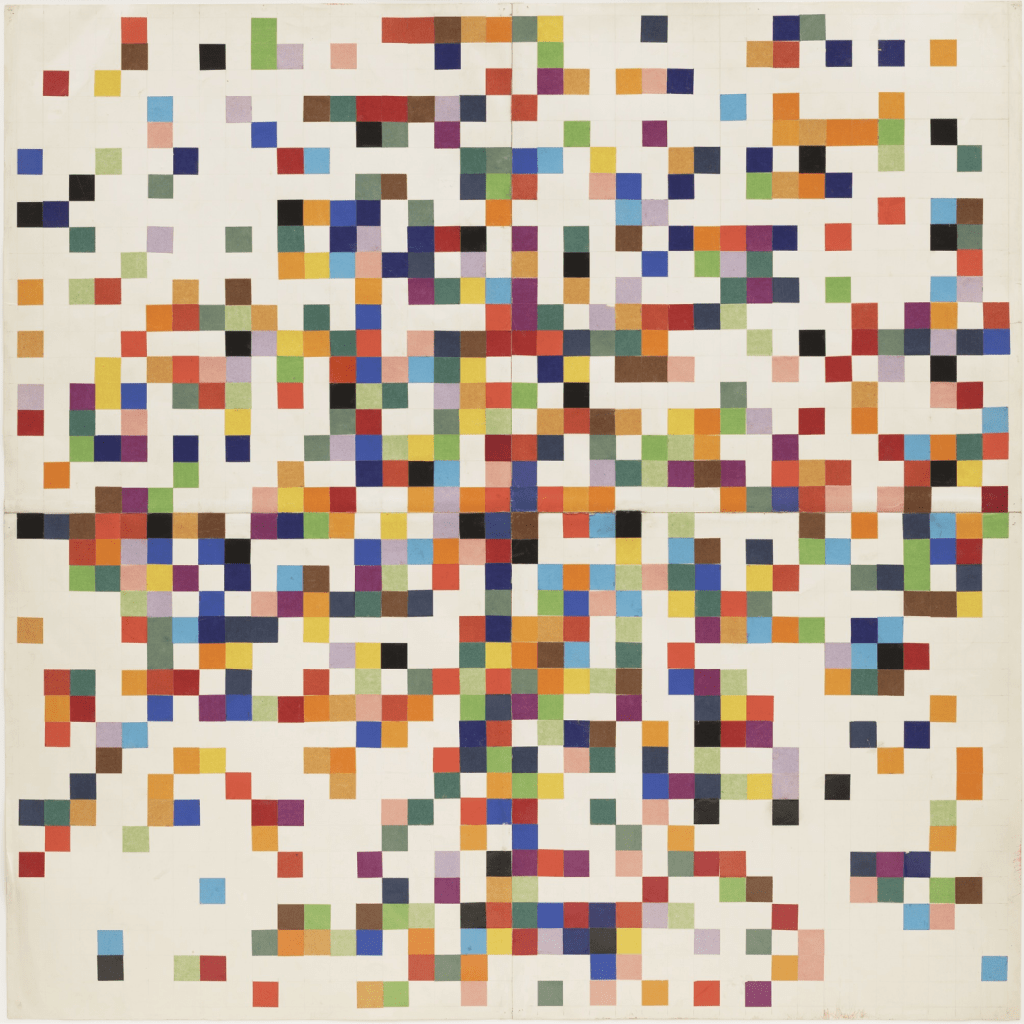
This piece stood out to me instantly because it reminded me of how my workstation looked as I worked on the hues from project 1. He randomly assigned each color chip to a place on the collage, and while our project was more methodical, he used the same method of small squares to achieve this look. Because his method was also randomized, it suggests that he didn’t have a strict end goal but wanted to communicate the relationships of each color chip in the piece.
